The Command Center for Construction Financial Intelligence
Project Metrics Hub unifies your financial data, project management tools, and AI-powered analytics into one powerful platform — giving construction leaders real-time visibility into every dollar, every job, and every decision.
Up and Running in Days, Not Months
Getting started with Project Metrics Hub is straightforward. We handle the heavy lifting so you can focus on building.
1. Connect Your Systems
Link your accounting software, project management tools, and data sources. We support Procore, Foundation, QuickBooks, Sage, and more.
2. We Configure Everything
Our team sets up your dashboards, maps your chart of accounts, and configures reports tailored to your specific business structure.
3. Gain Real-Time Visibility
Access your unified financial command center from anywhere. Revenue, margins, cash, jobs, labor, and AI insights all in one place.
Everything You Need to Run Your Construction Business Smarter
From executive overviews to granular job costing, Project Metrics Hub gives you the tools to make data-driven decisions across every aspect of your business.
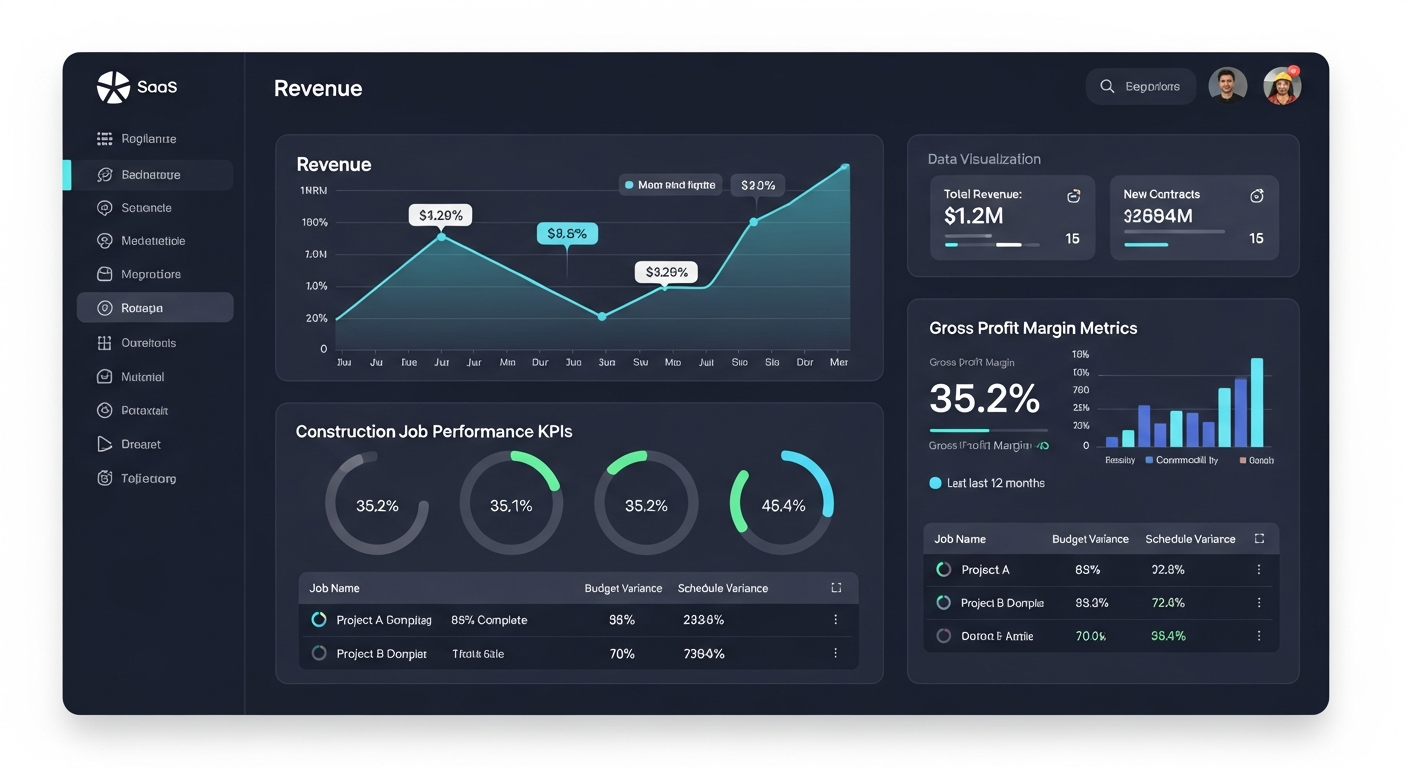
Executive Financial Overview
Configurable metric tiles with revenue, margins, cash, AR/AP at a glance. Your entire financial picture in one view.
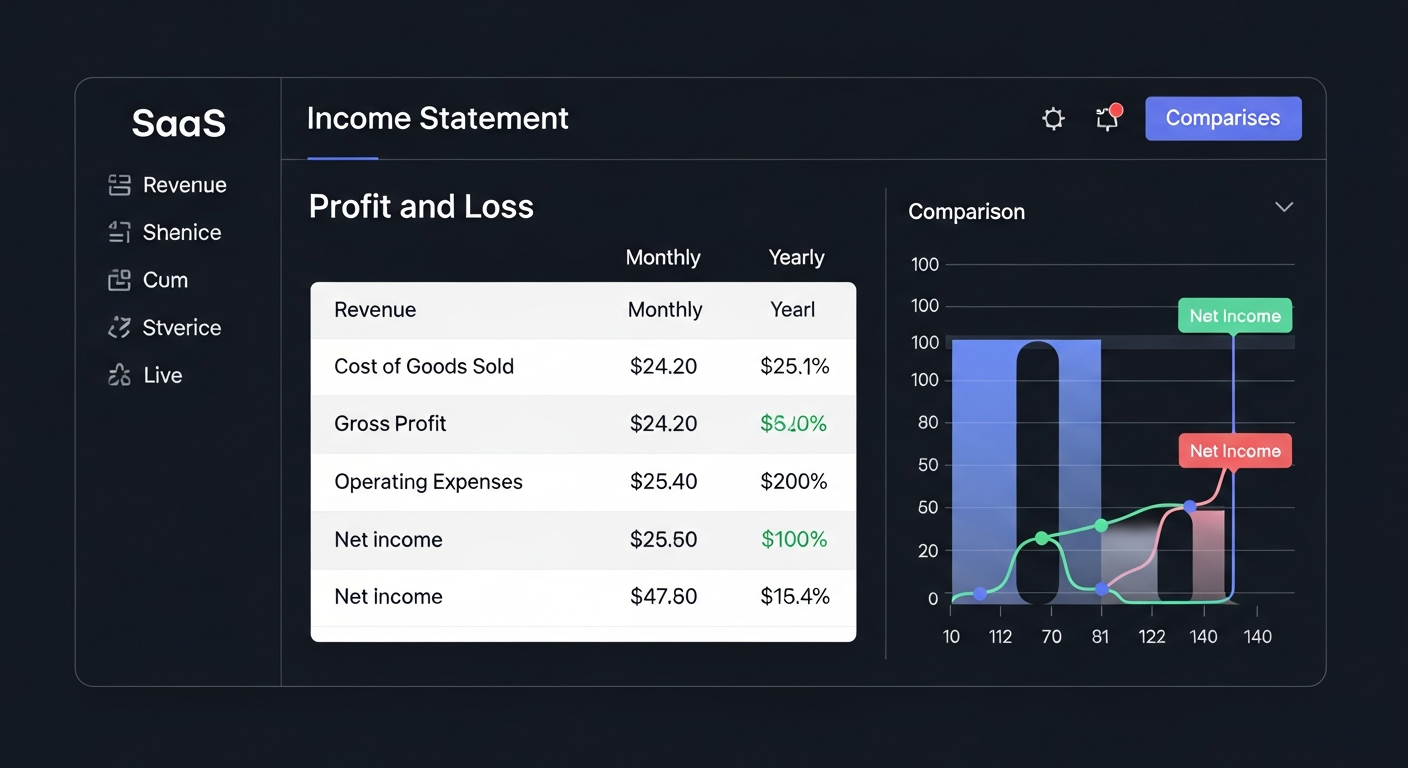
Income Statement & P&L
Hierarchical P&L with comparison modes, waterfall charts, and multi-year analysis for complete financial clarity.
Balance Sheet
Cumulative balances with detailed breakdowns and period comparisons. Track assets, liabilities, and equity over time.
Cash Flow Analysis
Indirect method statement of cash flows with AI-generated insights. Understand where your money is going.
Cash Position & Forecasting
Real-time cash balances, weekly reports, and transaction tracking. Know your cash position at any moment.
AP & AR Aging
Aging buckets by vendor/customer with charts and drill-down invoice details. Stay on top of payables and receivables.
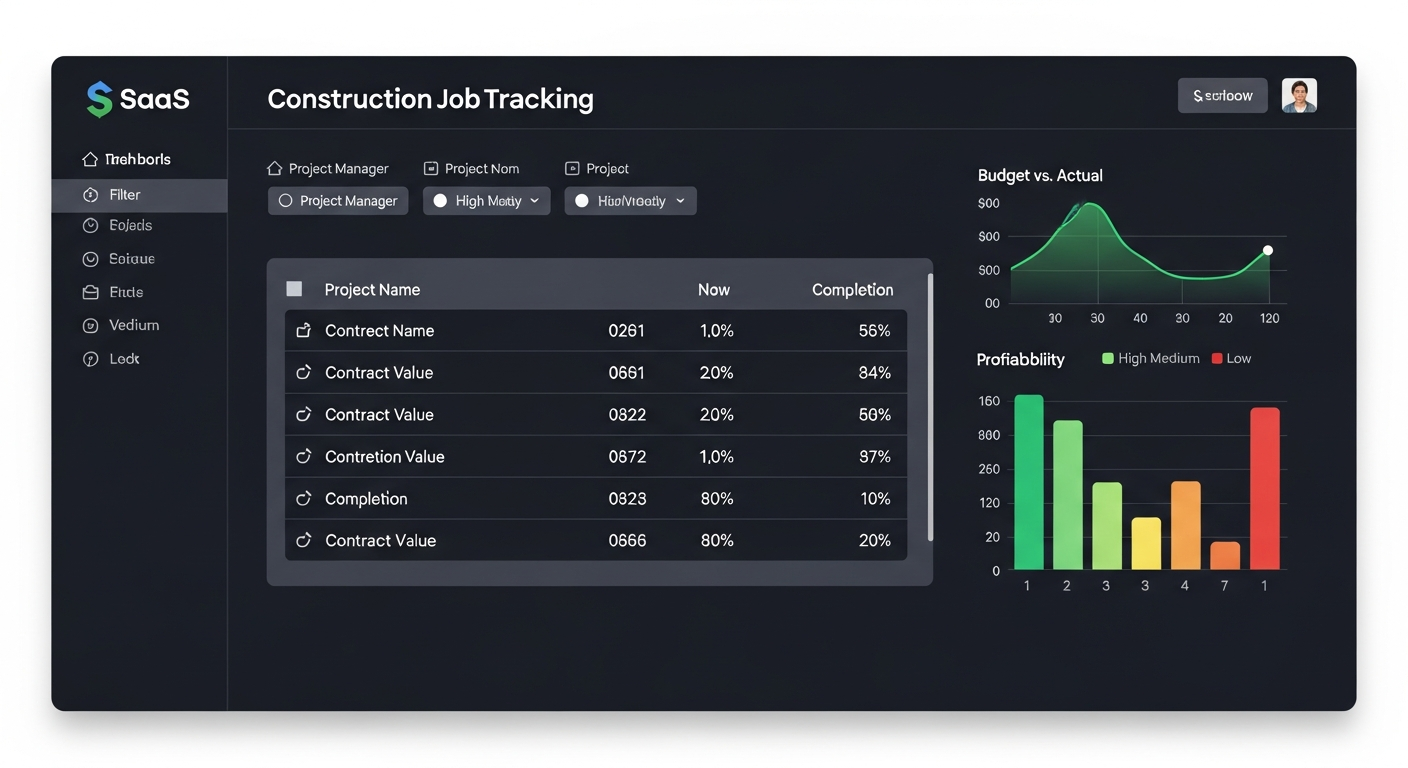
Job Cost Tracking
Budget vs actual, cost code analysis, and over/under billing by project. Control costs across every job.
Project Performance
Profitability heat maps, PM scorecards, and job completion tracking. See which projects drive results.
Labor Analytics
Employee hours by job, hour type breakdowns, and stacked visualizations. Optimize your workforce allocation.
Workforce Dashboard
Headcount trends, attrition, tenure distribution, and hire/term analysis. Understand your people metrics.
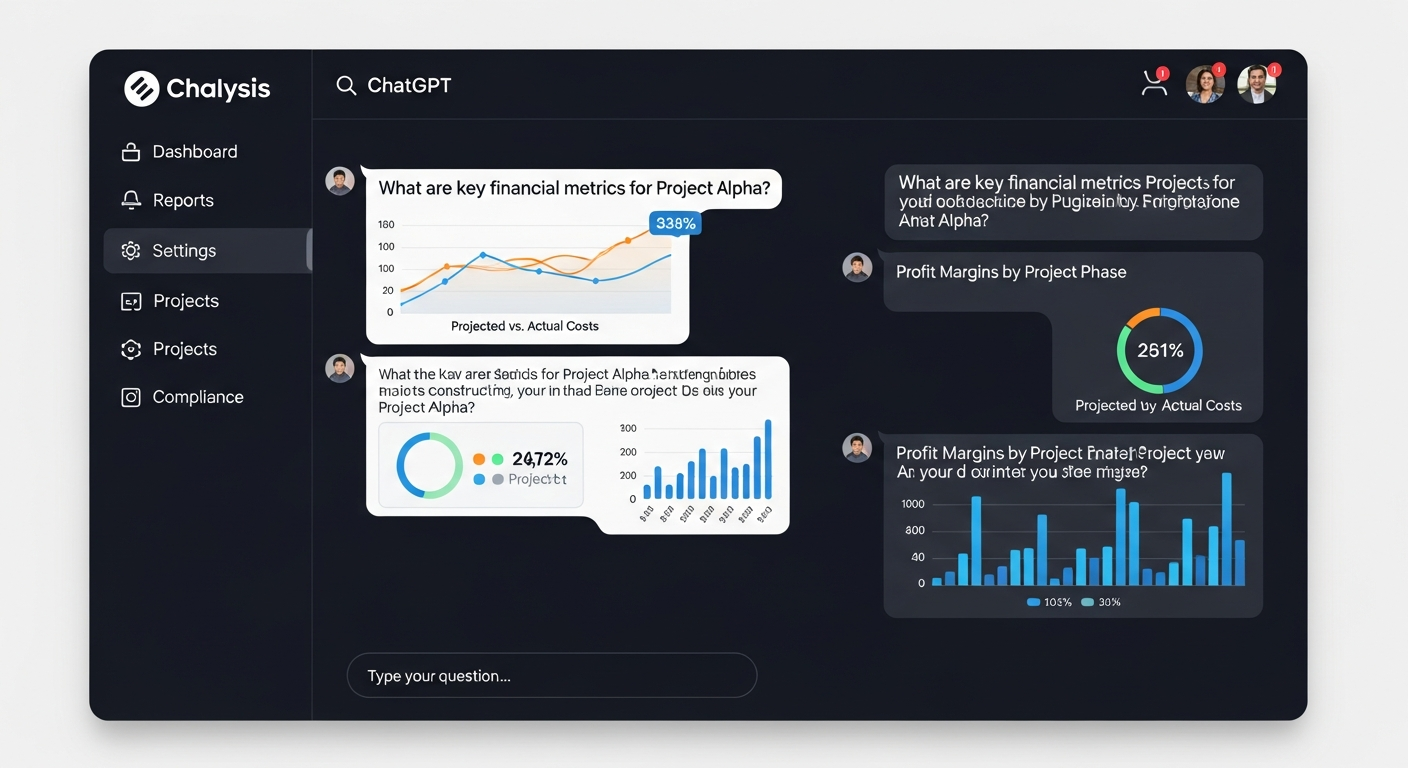
AI Business Intelligence
Natural language Q&A for financial and project data analysis. Ask questions, get instant answers with charts.
IS Forecasting
Income statement forecast grid with multiple input methods and cell comments. Plan your financial future with confidence.
Complete Financial Visibility at Your Fingertips
From income statements to cash flow analysis, get real-time financial reporting that your accounting team and executives both love. Compare periods, drill into accounts, and spot trends with interactive charts.
- ✓ Multi-year comparison
- ✓ Waterfall charts
- ✓ Account-level drilldown
- ✓ AI-powered analysis
 Financial Reports
Every Job, Every Dollar, One Dashboard
Track project profitability, monitor budgets vs actuals, analyze cost codes, and identify over/under billing across your entire portfolio. Built specifically for construction project management.
- ✓ Profitability heat maps
- ✓ Budget vs actual tracking
- ✓ Cost code analysis
- ✓ PM scorecards
 Job Management
Ask Your Data Anything
Our AI assistant understands construction finance. Ask natural language questions about your jobs, revenue, margins, and get instant, data-backed answers with visual charts.
- ✓ Natural language queries
- ✓ Context-aware responses
- ✓ Chart generation
- ✓ Semantic data catalog
 AI Assistant
Connect Your Entire Tech Stack
Project Metrics Hub integrates with the tools you already use, pulling data from multiple sources into one unified view.
Enterprise-Grade Security You Can Trust
Your financial data deserves the highest level of protection. We take security seriously at every layer of the platform.
Two-Factor Authentication (2FA)
TOTP-based 2FA for every user account. Add an extra layer of security to protect your sensitive financial data from unauthorized access.
Role-Based Access Control
Admin, Manager, and custom roles with granular permissions. Control exactly who sees what data across your organization.
Encrypted Data
All data encrypted in transit and at rest with industry standards. Your financial information is protected with bank-level encryption protocols.
Audit Logging
Complete activity tracking for compliance and accountability. Every action is recorded so you always know who did what and when.
Trusted by Construction Leaders
See how Project Metrics Hub is helping construction companies gain financial clarity and make better decisions.
"Before Project Metrics Hub, our financial reporting took days. Now I have real-time visibility into every metric that matters — revenue, margins, cash position — all in one place. It's completely transformed how we manage our finances."
"The job cost tracking is a game-changer. I can see budget vs actual for every project in seconds, catch over-billing issues early, and keep my projects on track. The PM scorecard feature alone is worth the investment."
"Having all our financial data, project metrics, and AI insights in one dashboard has made our executive meetings infinitely more productive. We make faster, better-informed decisions now. I can't imagine going back."