Powerful Features Built for Construction
Every dashboard, report, and tool you need to manage your construction company's financial health — all in one platform.
Your Entire Financial Picture in One View
Get a bird's-eye view of your entire financial operation. Configurable metric tiles let you track revenue, gross profit margins, operating profit, cash positions, AR/AP ratios, and over/under billing — all updated in real-time. Choose monthly, quarterly, or annual views. Compare to prior years. Show or hide trendlines and data labels.
- ✓ Drag-and-drop configurable tiles
- ✓ Multi-year period comparison
- ✓ Trendline overlays
- ✓ Responsive charts and data labels
- ✓ Year and period selectors
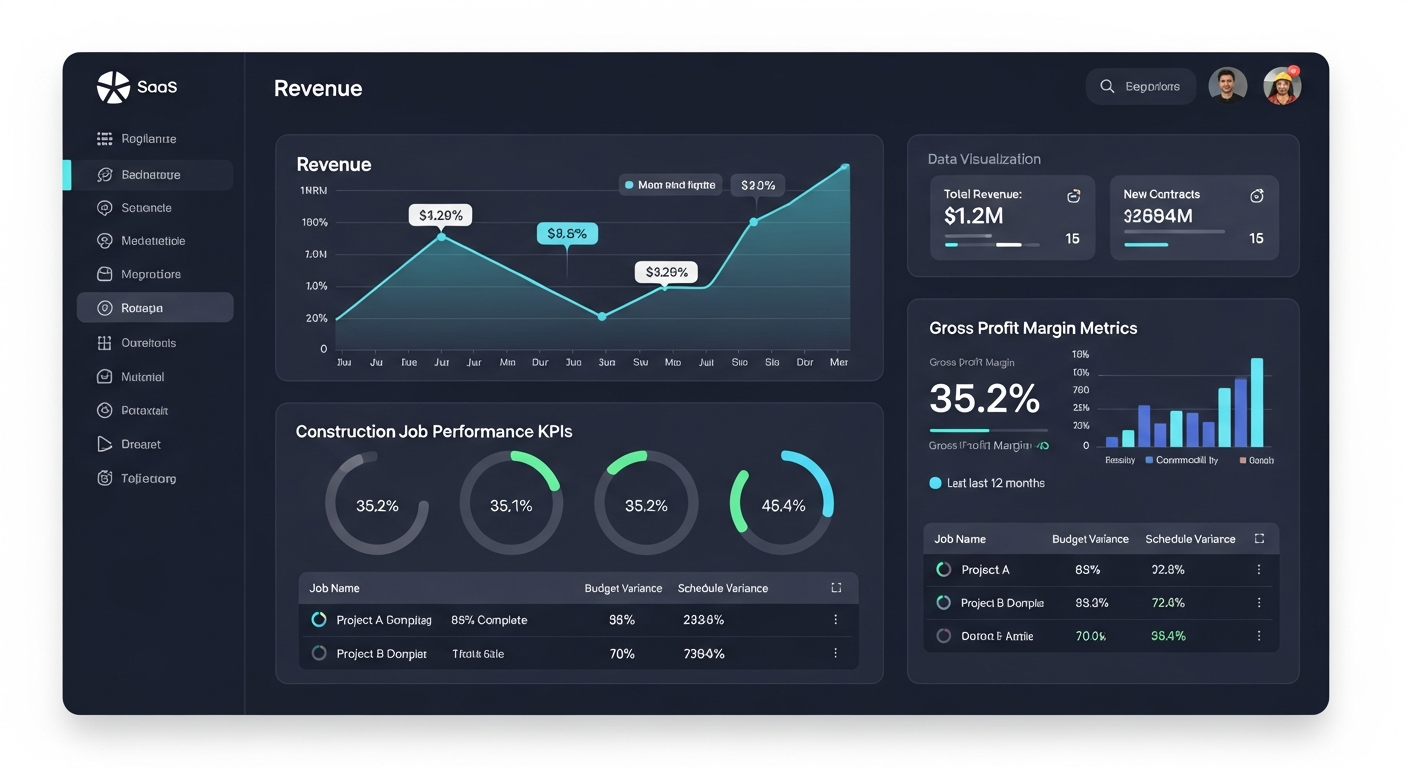 Executive Overview
Complete Profit & Loss Visibility
A fully hierarchical Profit & Loss statement with drill-down capability. View revenue, COGS, gross profit, operating expenses, and net income with period-over-period comparison. The revenue-to-operating-income waterfall chart makes it easy to visualize where margins are gained or lost.
- ✓ Hierarchical account grouping
- ✓ Period comparison (MoM, YoY)
- ✓ Waterfall chart visualization
- ✓ Account-level drilldown
- ✓ Export to PDF
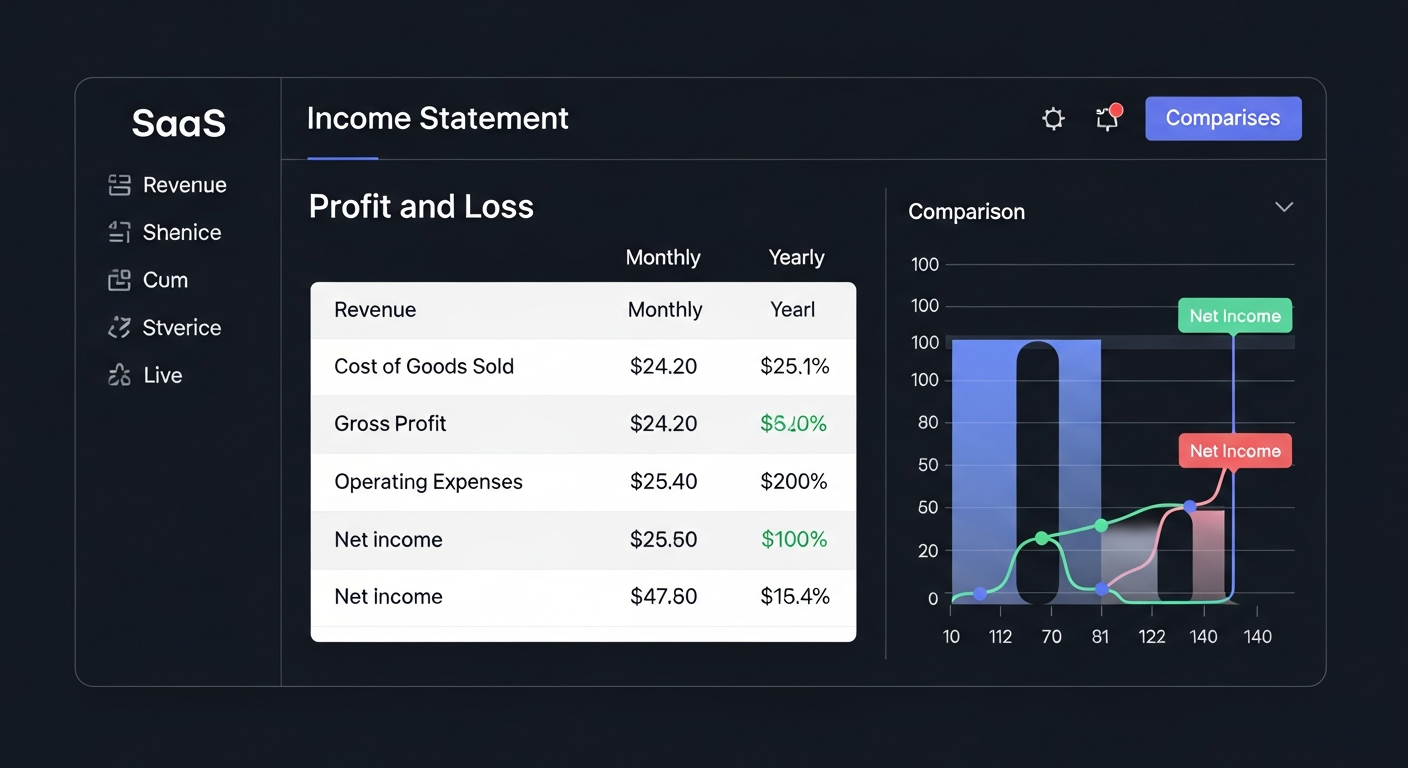 Income Statement
Track Assets, Liabilities & Equity Over Time
View cumulative balances across all asset, liability, and equity accounts. Break down by sub-category with expandable detail rows. Compare across periods and track balance trends over time.
- ✓ Cumulative balance tracking
- ✓ Asset/Liability/Equity breakdown
- ✓ Period comparison
- ✓ Expandable detail rows
Know Where Every Dollar Goes
Indirect method Statement of Cash Flows with AI-powered analysis. Track your cash position across all bank accounts with weekly cash reports featuring auto-generated executive summaries. Monitor cash inflows, outflows, and net changes with full transaction detail.
- ✓ Indirect method cash flow statement
- ✓ AI-generated cash analysis
- ✓ Multi-account cash tracking
- ✓ Weekly cash reports with executive summary
- ✓ Transaction-level detail
Stay on Top of Payables & Receivables
Comprehensive aging reports grouped by vendor (AP) or customer (AR) with standard aging buckets (Current, 1-30, 31-60, 61-90, 90+ days). Interactive charts visualize aging distribution. Click any line item to see full invoice details in a modal overlay.
- ✓ Standard aging buckets
- ✓ Vendor and customer grouping
- ✓ Interactive charts
- ✓ Invoice detail modals
- ✓ One-click email reports
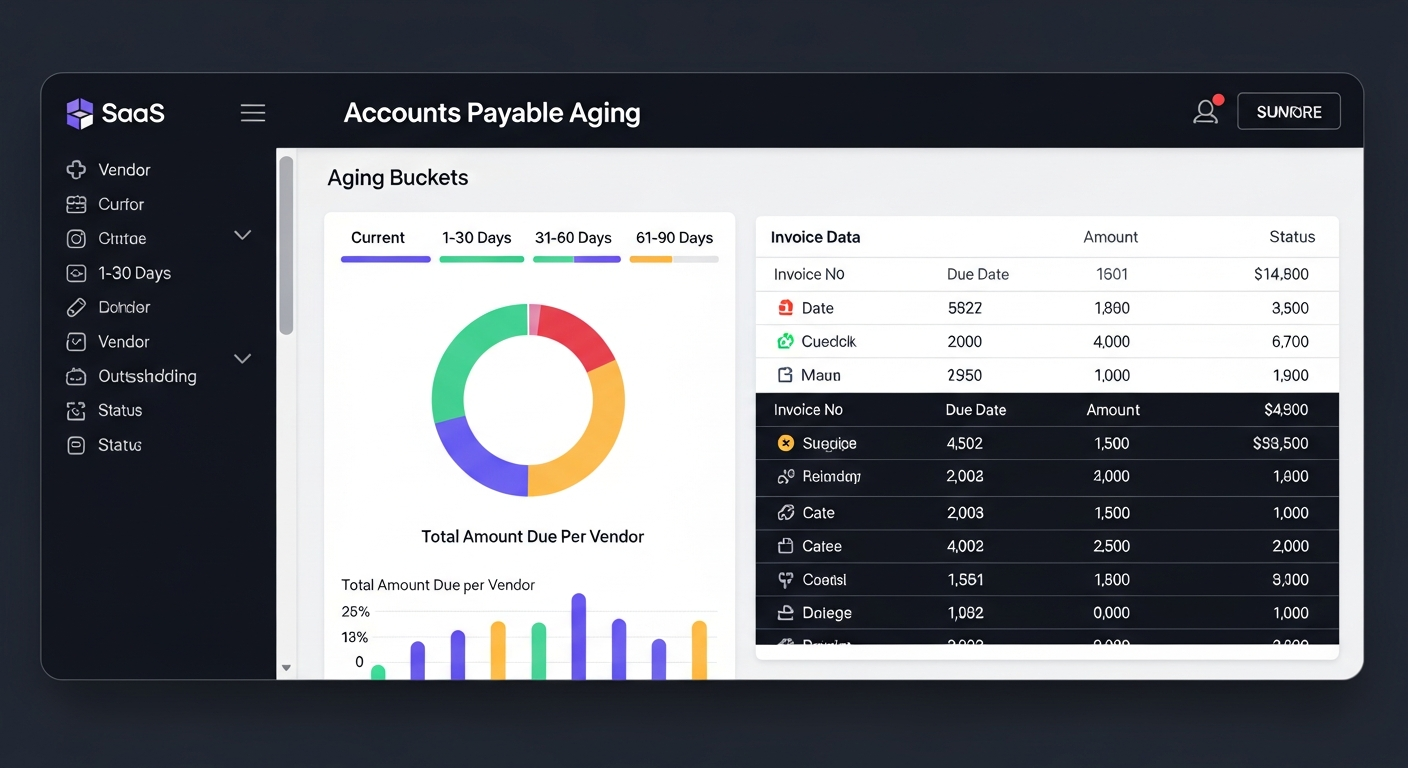 Aging Reports
Every Job, Every Dollar, One Dashboard
The Jobs module is your one-stop shop for project financial performance. View budgets vs. actuals by job, analyze cost codes (CSI format), track over/under billing, and identify at-risk projects with the profitability heat map. Filter by project manager, status, or customer.
- ✓ Budget vs actual tracking
- ✓ 11 CSI cost code categories
- ✓ Over/under billing analysis
- ✓ Profitability heat map
- ✓ PM performance scorecards
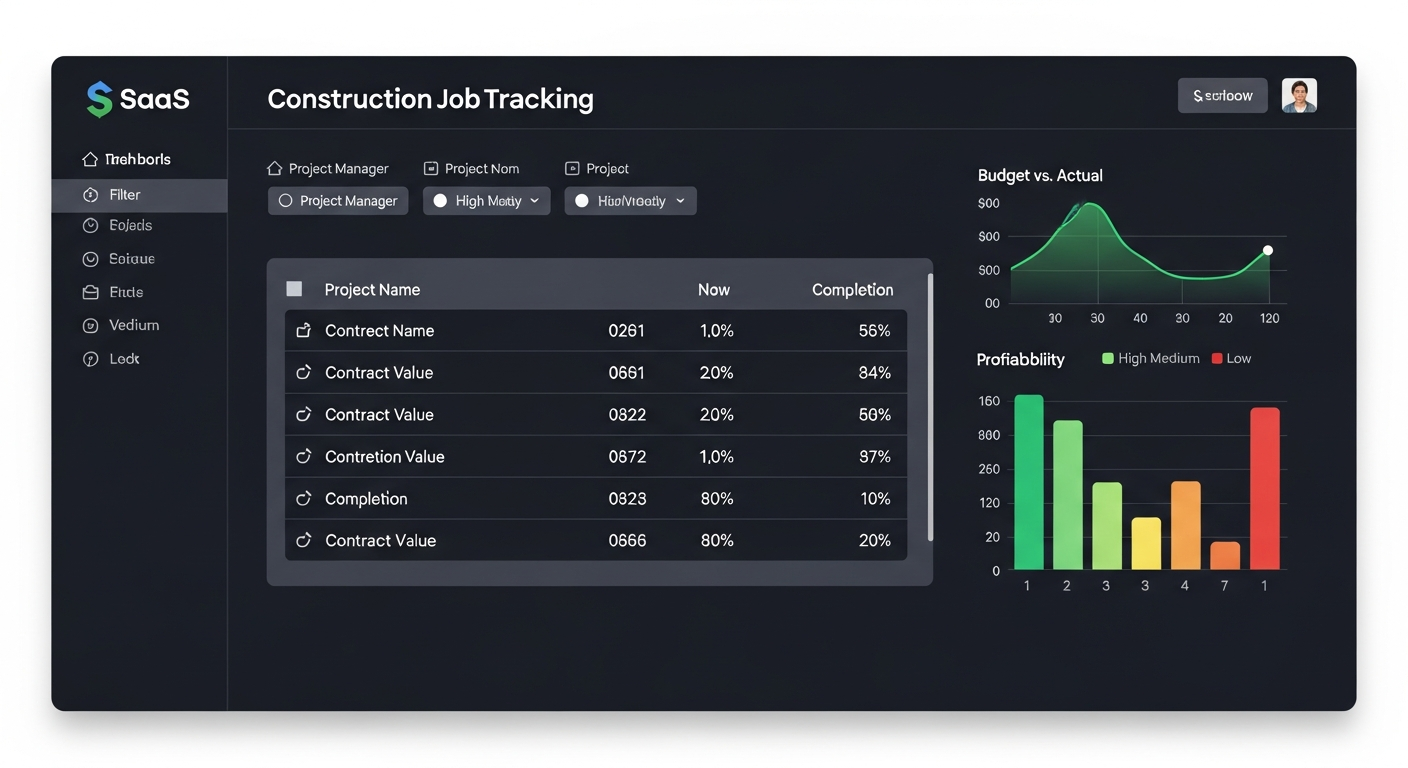 Job Management
Optimize Workforce Allocation
Track employee hours by job with breakdowns by hour type (regular, overtime, PTO, holiday). Stacked bar charts visualize labor distribution. Aggregate and pivot data for workforce planning and job cost allocation.
- ✓ Hours by job breakdown
- ✓ Hour type categorization
- ✓ Stacked bar visualization
- ✓ Labor allocation tracking
- ✓ Employee-level detail
Understand Your People Metrics
Executive-level workforce analytics with KPIs for headcount, new hires, terminations, attrition rate, and tenure distribution. Visual charts track trends over time to support HR and operational decisions.
- ✓ Headcount trends
- ✓ Attrition rate tracking
- ✓ Tenure distribution
- ✓ Hire and termination analysis
- ✓ Department breakdowns
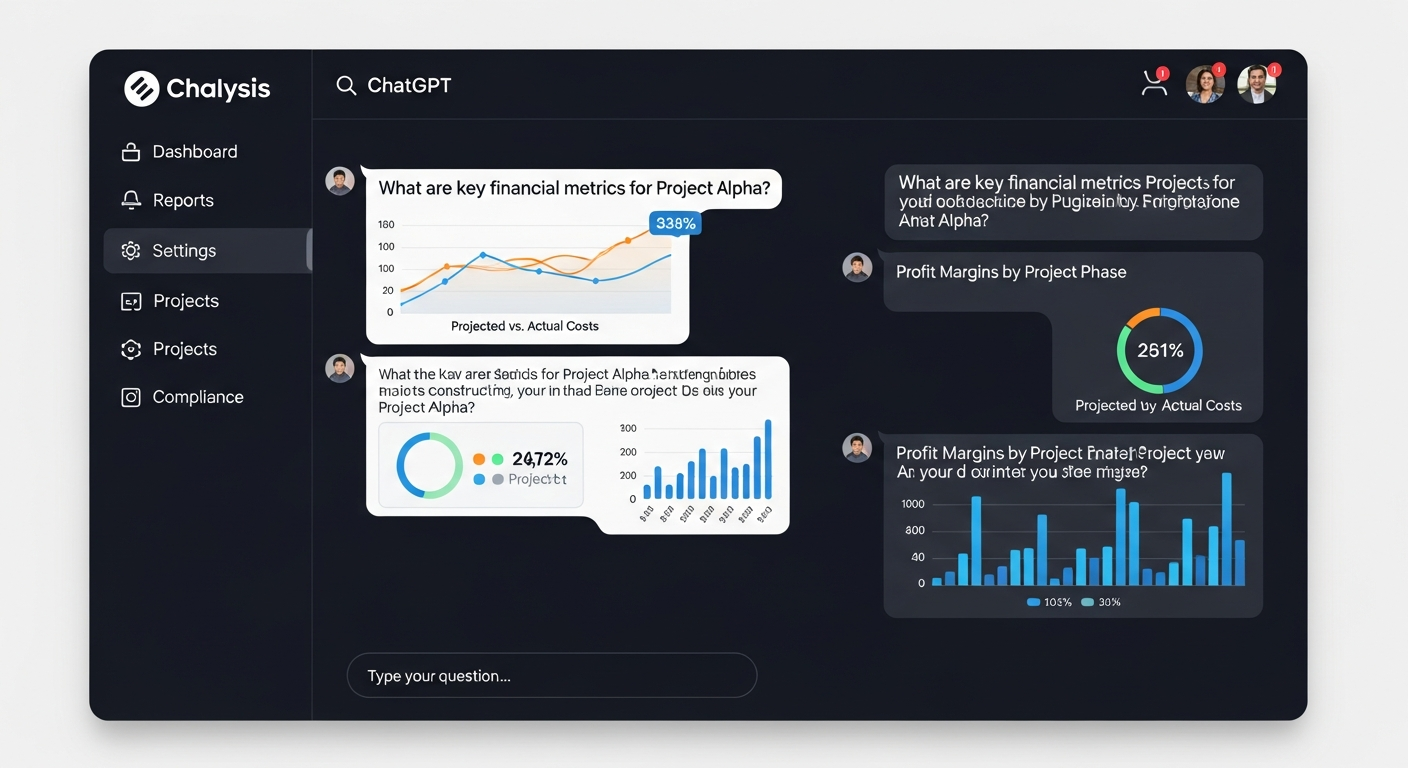
Ask Your Data Anything
Ask questions about your financial and project data in plain English. Our AI assistant uses a semantic data catalog to understand your construction business context and delivers data-backed answers with interactive charts. No SQL required.
- ✓ Natural language interface
- ✓ Context-aware responses
- ✓ Chart and table generation
- ✓ Semantic data catalog
- ✓ Construction industry knowledge
 AI Assistant
Plan Your Financial Future
Build forward-looking income statement forecasts with a flexible grid interface. Enter forecasts using multiple methods — manual entry, percentage growth, or formula-based. Add cell-level comments for assumptions. Compare forecasts to actuals as periods close.
- ✓ Flexible forecast grid
- ✓ Multiple input methods
- ✓ Cell-level commenting
- ✓ Forecast vs actual comparison
- ✓ Multi-scenario planning